
SmartOLT draws graphs from the data that it collects from your OLTs. The Graphs page shows the graphs of the OLTs, the uplink ports, the PON ports and the ONUs, and the ONU page shows the traffic and signal graphs of one ONU.
This guide shows where you find each graph and how to read it.
1Open the Graphs page
Click Graphs in the top menu.
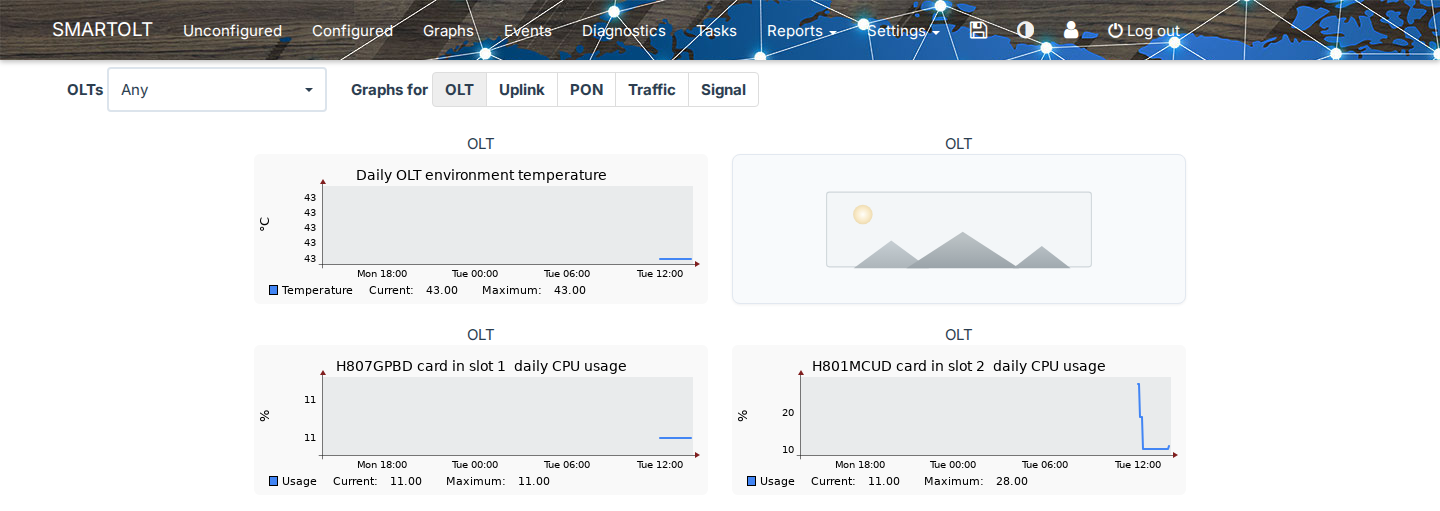
- In OLTs, select one OLT. If you select Any, you see the graphs of all your OLTs.
- In Graphs for, click the type of graph: OLT, Uplink, PON, Traffic or Signal.
Each small graph shows the last day, except the Signal graphs, which show the last week. SmartOLT shows 20 graphs on each page, so use the page links under the graphs to see the others.
You need the right to view graphs. If your SmartOLT user does not have it, the Graphs menu does not open the page.
2Read the OLT graphs
OLT shows the health of the OLT hardware.
| Graph | What it shows |
|---|---|
| OLT environment temperature | The temperature that the OLT reports, in °C. |
| Fan speed | The speed of the OLT fans. |
| CPU usage | The CPU load of each board, in percent. The title shows the board type and the slot, for example H801MCUD card in slot 2. |
| Memory usage | The memory use of each board, in percent. |
| MAC table usage | The number of entries in the MAC address table of the OLT. |
Under each graph, Current shows the last value and Maximum shows the highest value in the period.
An empty frame means that SmartOLT has no data for this graph yet. Some OLT models also do not report all values, for example the fan speed.
3Read the uplink and PON graphs
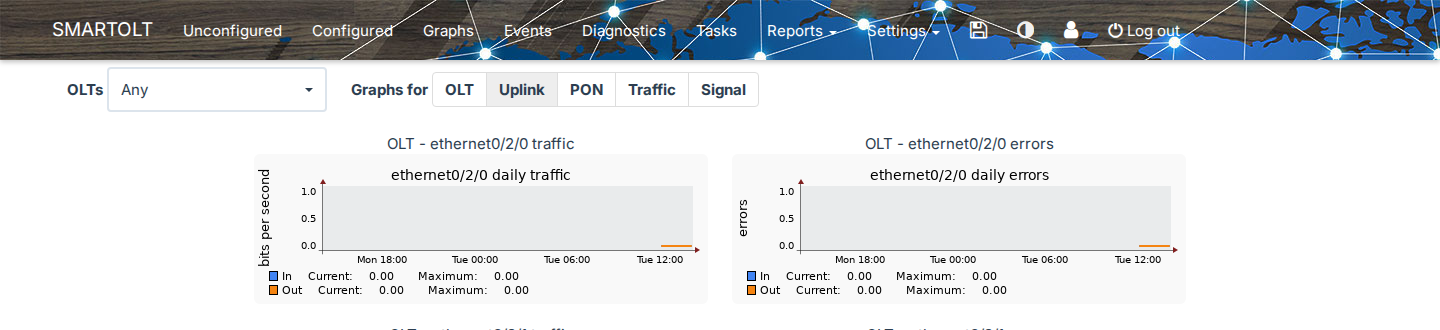
Uplink shows two graphs for each uplink port of the OLT.
| Graph | What it shows |
|---|---|
| ... traffic | The traffic on the uplink port, in bits per second. In is the traffic that enters the OLT, and Out is the traffic that leaves the OLT. |
| ... errors | The errors that the OLT counts on the uplink port. |
PON shows the traffic of each PON port, for example gpon 1/0.
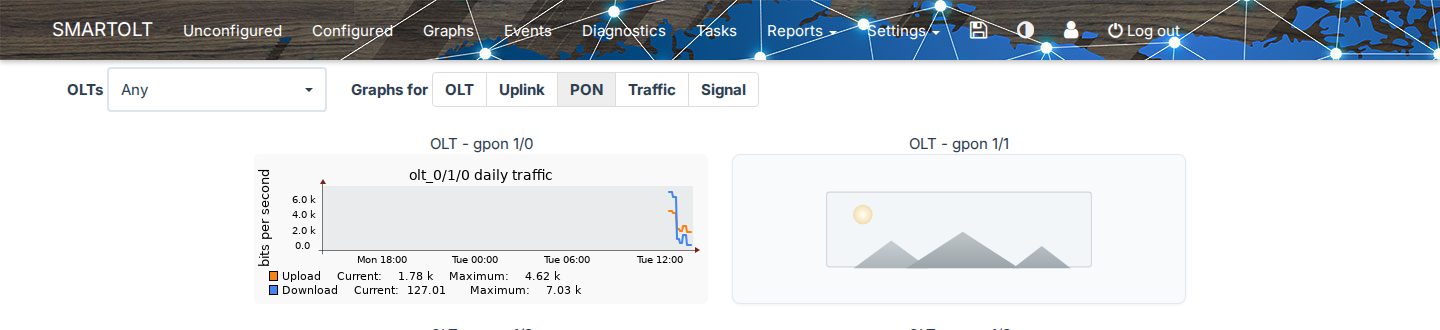
The graph shows Upload and Download in bits per second. Because the PON graph shows the total of all ONUs on the port, you cannot use it for one customer. To see the traffic of one customer, use the ONU graphs.
4Read the ONU traffic and signal graphs
Traffic and Signal show one graph for each ONU, with the OLT name and the ONU name above the graph.
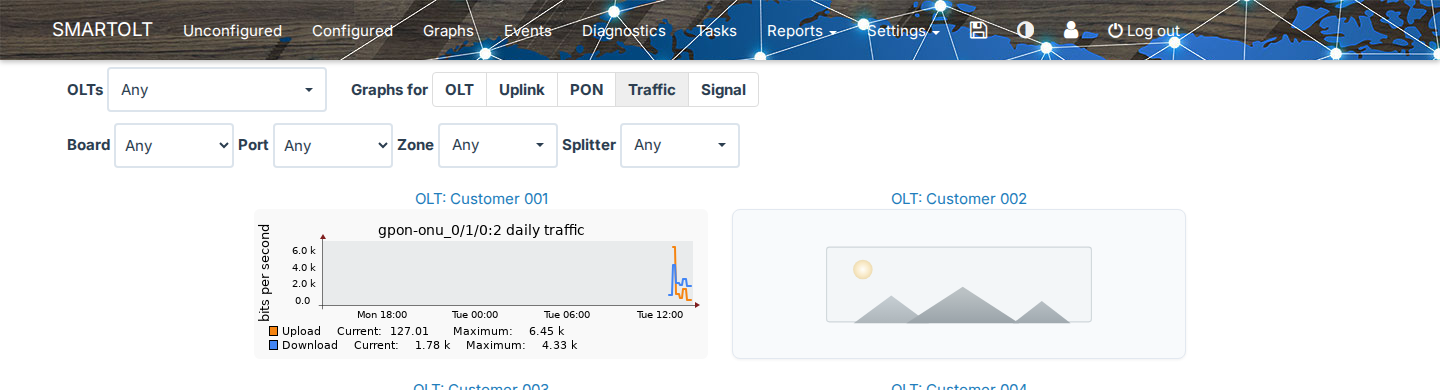
Use the filters to find the ONUs:
- Board and Port: the PON port of the ONU.
- Zone: the zone of the ONU.
- Splitter: the splitter of the ONU.
| Graph | What it shows |
|---|---|
| Traffic | The Upload and Download of the ONU, in bits per second, for the last day. |
| Signal | The optical signal of the ONU, for the last week. |
To open the ONU page, click the name above the graph.
If no ONU matches the filters, SmartOLT shows No traffic graphs found. or No signal graphs found.
5Open the graphs for a longer period
Click a graph, and a window opens with the same graph for more periods.
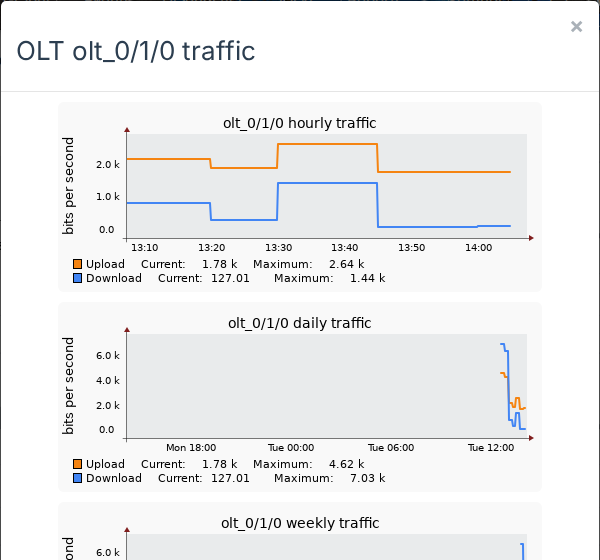
| Graph type | Periods in the window |
|---|---|
| OLT, uplink, PON port, ONU traffic | Hourly, daily, weekly, monthly and yearly. |
| ONU signal | Daily, weekly, monthly and yearly. |
The monthly and yearly traffic graphs can show two lines for each direction. Avg is the average traffic, and P95 is the 95th percentile, which means the level that the traffic stays under for 95% of the time.
If you want the window on the right side of the screen, click Right on the edge of the window. Click Center to move it back.
6Read the graphs on the ONU page
Open the ONU page. The Traffic/Signal row shows two graphs, one for the traffic and one for the signal, and by default they show the last 24 hours.

In the image, the traffic graph is zoomed in. The ONU is new, so the signal graph has no data yet.
- Turn the mouse wheel over a graph to zoom in or out. The shortest range is 5 minutes, and the longest range is 30 days.
- Drag the graph to the left or to the right to move in time.
- Click the arrow icon (Back to 24h view) to show the last 24 hours again.
- Click the green ... icon (More graphs) to open the window with the daily, weekly, monthly and yearly graphs.
The icons are under each graph, next to the legend. To see the name of an icon, point at it with the mouse.
The legend shows the Current and the Maximum value of each line, and the traffic legend shows the values in Mbps or Gbps.
If you want to see how much data the ONU used, click the bar chart icon (Traffic usage) in the traffic legend. The table shows the Download, Upload and Total for today, yesterday, this week, this month and this year, and Top usage opens the Traffic usage report.
If the ONU has no graph data yet, SmartOLT shows Graph data is not yet available for this device.
For the other parts of the ONU page, see Manage an authorized ONU.
Administrators also see the red trash icon (Delete graph history) in the legend. This icon deletes the traffic history, or the signal and status history, of the ONU. SmartOLT asks Are you sure? The history cannot be recovered., and after you confirm, you cannot undo it.
The LIVE! button on the ONU page shows the traffic of the ONU in real time, so it is useful while the customer tests the connection.