
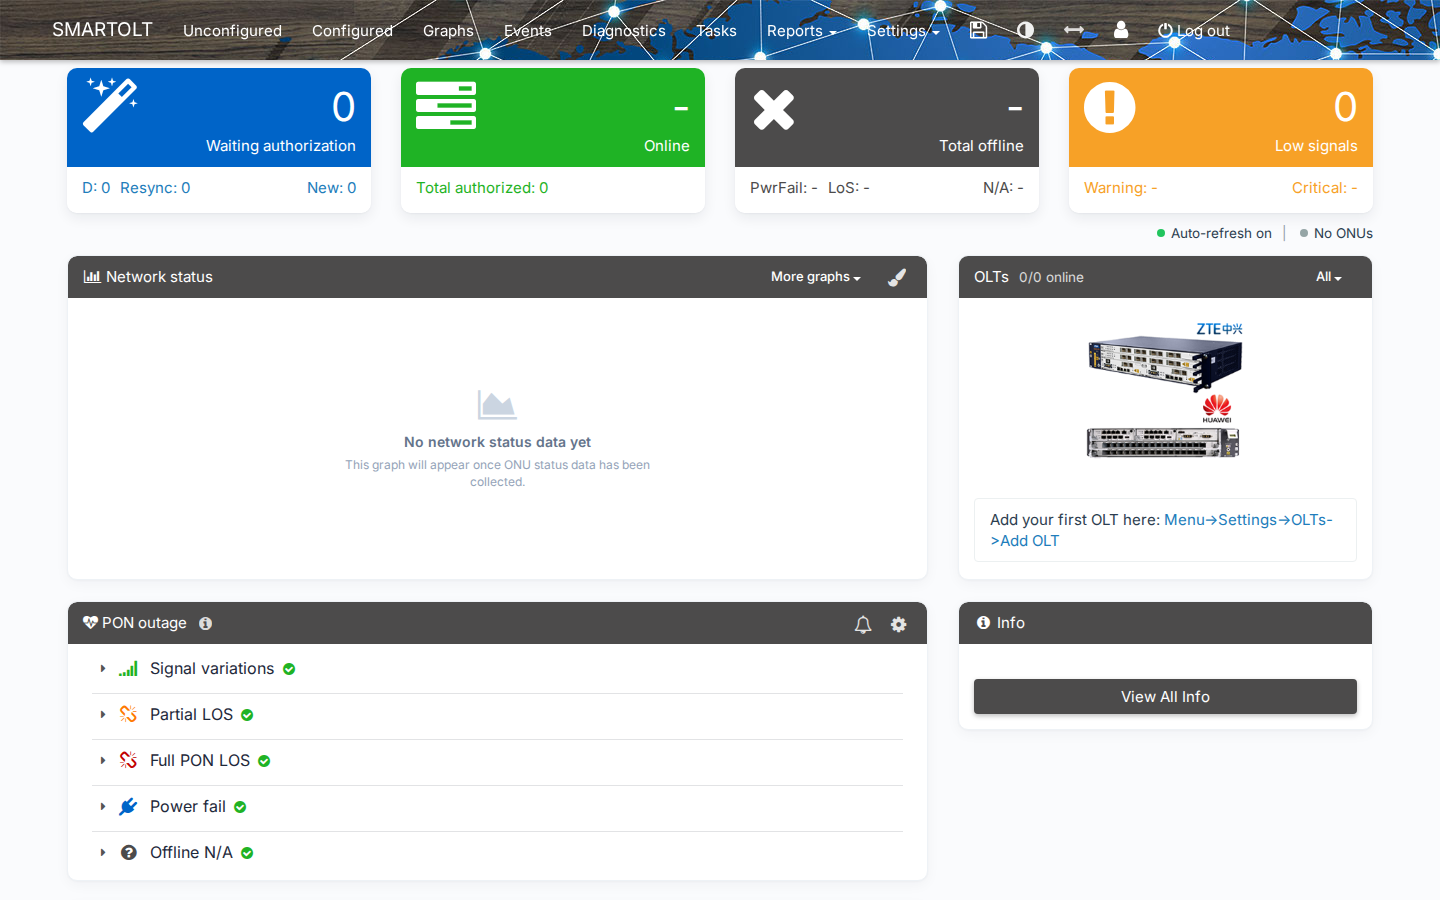
The dashboard is the first page you see after you log in. It shows the state of your network: the ONUs that wait for authorization, the ONUs that are online and offline, low signals and PON outages. Every number on the dashboard is a link, so you can click it to open the list behind it.
Choose the OLTs
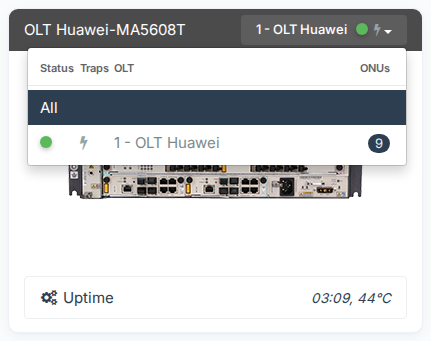
By default, the dashboard shows all your OLTs together. If you want to see only one OLT, use the drop-down list in the heading of the OLTs panel, on the right.
- Click the drop-down list. It shows All and then every OLT.
- Click an OLT, and the dashboard shows only the data of that OLT.
- To return to all OLTs, click All.
Each OLT in the list shows its Status dot, its Traps icon, its name and the number of ONUs. If you have 10 OLTs or more, a search field appears at the top of the list.
If your account has only one OLT, the dashboard selects it for you.
The links in the status boxes follow your choice. For example, when one OLT is selected, Online opens the Configured list filtered by that OLT.
The status boxes
The four boxes at the top show the ONU counts. Click the large number to open the full list, or click a value in the lower line to open a filtered list.

Waiting authorization
The large number is the count of ONUs that the OLTs detect but that are not authorized yet. Click it to open Unconfigured.
| Value | What it counts |
|---|---|
| D: | ONUs that are administratively disabled on the OLT. |
| Resync: | ONUs that SmartOLT already knows, which wait to be resynced or moved. |
| New: | ONUs that SmartOLT does not know yet and that wait for authorization. |
To authorize an ONU, see Authorize an ONU.
When All is selected and you have 25 OLTs or more, this box shows -. To see the counts, select one OLT or open Unconfigured.
Online
The large number is the count of ONUs that are online now, and Total authorized is the count of all authorized ONUs. Click the box to open Configured.
Total offline
The large number is the count of authorized ONUs that are offline. Click it to open Configured with the list of all offline ONUs.
| Value | What it counts |
|---|---|
| PwrFail: | ONUs that went offline because they lost power. |
| LoS: | ONUs that went offline because of a loss of signal, for example a cut fiber. |
| N/A: | ONUs that have not been online since the OLT restarted. |
Click a value to open Configured with only those ONUs.
Low signals
The large number is the count of ONUs with a low signal. SmartOLT compares the OLT Rx signal of each ONU with two thresholds of the OLT, and it counts only the signal readings from the last 24 hours. Click the box to open Diagnostics with all ONUs that have a low signal.
| Value | What it counts |
|---|---|
| Warning: | ONUs with a signal lower than the warning threshold, but above the critical threshold. |
| Critical: | ONUs with a signal lower than the critical threshold. |
Click a value to open Diagnostics with only those ONUs.
You set the thresholds separately for each OLT. Go to Settings → OLTs, open the OLT, open the Advanced tab and click Edit Advanced. Then change Signal RX level "warning" (dBm) and Signal RX level "critical" (dBm) and save.
Auto-refresh
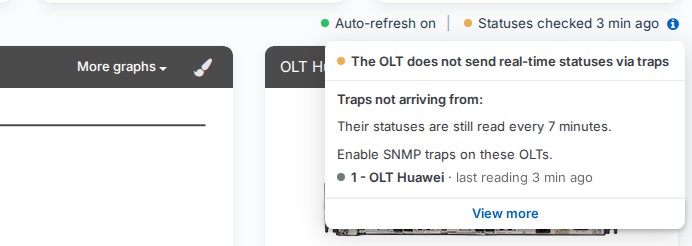
The dashboard updates by itself, so you do not need to reload the page. The line under the status boxes shows how fresh the data is.
| Text | What it means |
|---|---|
| Auto-refresh on | The page has a live connection to SmartOLT, so the counts change as soon as the status of an ONU changes. |
| Info updated ... min ago | The page asks SmartOLT for new data at regular intervals, and the text shows when the last answer arrived. |
The second line shows how fresh the ONU statuses are.
| Text | What it means |
|---|---|
| Real-time statuses | The OLTs send status changes to SmartOLT through SNMP traps. |
| Statuses checked ... min ago | SmartOLT reads the statuses from the OLTs, and the text shows when it last read them. |
| No recent statuses | SmartOLT does not have a recent status reading. |
The info icon next to this line shows how many OLTs send real-time statuses through traps. It also lists the OLTs that do not send traps and tells you what to do for each one. SmartOLT still reads the statuses of these OLTs every 7 minutes. To enable traps, see Enable SNMP traps.
The dashboard pauses its updates while the browser tab is hidden or while you are idle. When you come back, it starts to update again.
Network status graph
The Network status graph shows how many ONUs were in each status over time: Online, Power fail, LOS and Offline. By default, it shows the daily graph.
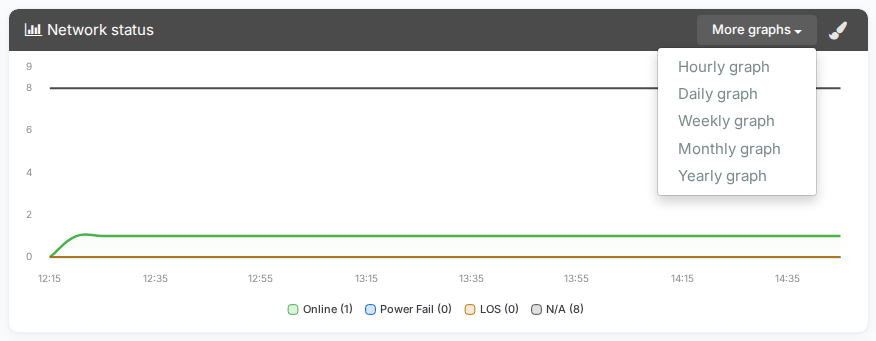
- Click More graphs to choose Hourly graph, Daily graph, Weekly graph, Monthly graph or Yearly graph.
- Use Customize colors to change the color of each line, and Reset to defaults to restore the original colors. SmartOLT saves your colors for your SmartOLT user.
If the graph shows No network status data yet, SmartOLT has not collected any ONU statuses yet. The graph appears after the first collection.
For traffic and signal graphs of OLTs, PON ports and ONUs, use Graphs in the top menu.
PON outage panel
The PON outage panel lists the PON ports that have a problem now. It has five sections: Signal variations, Partial LOS, Full PON LOS, Power fail and Offline N/A. When there is no problem, it shows All clear. No active alerts.
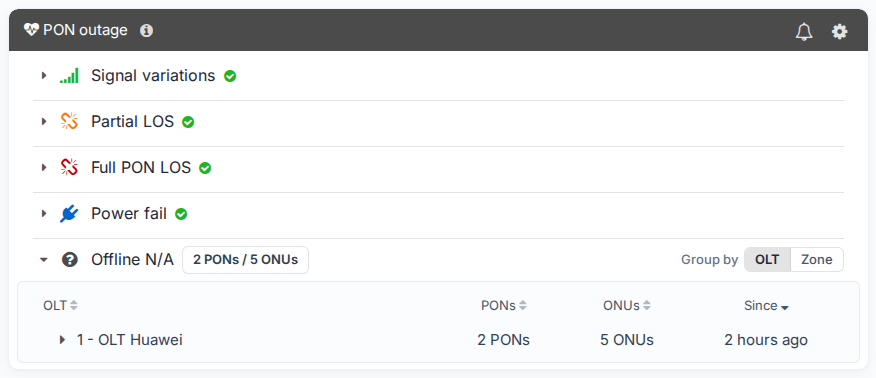
You can group and sort each section, and SmartOLT remembers your choices. If you are an administrator, you also see two icons in the panel heading:
- The bell opens Notifications, where you set up Telegram alerts.
- The gear opens PON alert settings, where you set the thresholds for Signal variations and Partial LOS.
For the meaning of each section and for the alert setup, see Get alerts for PON outages, loops and rogue ONUs.
ONU authorizations per day
The ONU authorizations per day graph shows how many ONUs were authorized on each day of the last month. It shows GPON and EPON ONUs separately.
OLTs panel
When All is selected, the panel heading shows OLTs and how many of them are online, for example 5/6 online. The panel lists every OLT with its uptime and its temperature, and you can click an OLT to show the dashboard for that OLT only.
When one OLT is selected, the panel shows that OLT: the model in the heading, a picture of the OLT, its Uptime and its temperature. If your account has only one OLT, the dashboard selects it for you, so the panel opens in this view, and the selector in the heading lists All and the OLT.
| What you see | What it means |
|---|---|
| Temperature in orange | The temperature is above the warning level of the OLT. |
| Temperature in red | The temperature is above the critical level of the OLT. |
| N/A in red | SmartOLT cannot read the uptime of the OLT. |
You set the temperature levels in the Advanced tab of the OLT, in OLT temperature level "warning" (°C) and OLT temperature level "critical" (°C).
If you have more than 6 OLTs, warning icons appear next to the online count when an OLT has a problem.
- Click the orange icon to show only the OLTs with a warning.
- Click the red icon to show only the OLTs with a critical problem.
- To show all OLTs again, click the icon again or click OLTs.
If you do not have an OLT yet, the panel shows a link to add one. See Getting started.
Info panel
The Info panel shows the last 10 changes in SmartOLT, for example an ONU authorization. Each line shows how long ago the change happened, and if the line is about an ONU, you can click it to open the ONU page.
Click View All Info to open the full list of changes. When one OLT is selected, the list shows only the changes on that OLT.
Users in the readonly_users and call_center groups do not see the Info panel.
The top menu
The top menu leads to every part of SmartOLT. Each user sees only the menu items that their permissions allow.
| Menu item | What you do there | Manual section |
|---|---|---|
| Unconfigured | Find and authorize new ONUs, and set up automatic actions for new ONUs. | Authorize an ONU, Authorization presets and auto-authorization, Auto actions: authorize, move and resync |
| Configured | Find authorized ONUs, open the ONU page and run batch actions. | Find ONUs in the Configured list, Manage an authorized ONU, Batch actions, Configure WiFi and internet (WAN) on an ONU with TR-069 |
| Map | See ONUs and network objects on a map. | |
| Graphs | See traffic and signal graphs. | Graphs |
| Events | See the history of network events, such as PON outages. | Get alerts for PON outages, loops and rogue ONUs |
| Diagnostics | See ONUs with their signal levels. The Low signals box links here. | Diagnostics |
| Tasks | See scheduled and running tasks. | Tasks |
| Reports | Open Authorizations, Export, Import, Traffic usage and Find config mismatches (DB vs OLT). | Authorizations report, Export and import ONUs, Traffic usage, Find config mismatches |
| Settings | Manage Zones, Sectors, Splitters, ONU types, Speed profiles, OLTs, VPN & TR069, Presets, General (users, notifications, API key) and Billing. | Zones, Sectors, Splitters, ONU types, Speed profiles, Add an OLT and check its status, OLT VLANs and IP pools, Configure TR-069, ONU configuration presets, Users, roles, restriction groups and API keys, General settings and billing |
If your SmartOLT user does not have permission to view dashboard statistics, the status boxes show - and the graphs stay empty.